Blogging Again
So I guess it’s been a while since I blogged. I was encouraged to start again by this post.
I’m studying R for my MSc in Psychology (research methods, part of my evil plan to retrain as a psychologist/neuroscientist so I can better understand what we build at BioBeats. I like that blogdown and hugo let you embed an R code chunk like this:
summary(cars)
##      speed           dist
##  Min.   : 4.0   Min.   :  2.00
##  1st Qu.:12.0   1st Qu.: 26.00
##  Median :15.0   Median : 36.00
##  Mean   :15.4   Mean   : 42.98
##  3rd Qu.:19.0   3rd Qu.: 56.00
##  Max.   :25.0   Max.   :120.00
fit <- lm(dist ~ speed, data = cars)
fit
##
## Call:
## lm(formula = dist ~ speed, data = cars)
##
## Coefficients:
## (Intercept)        speed
##     -17.579        3.932
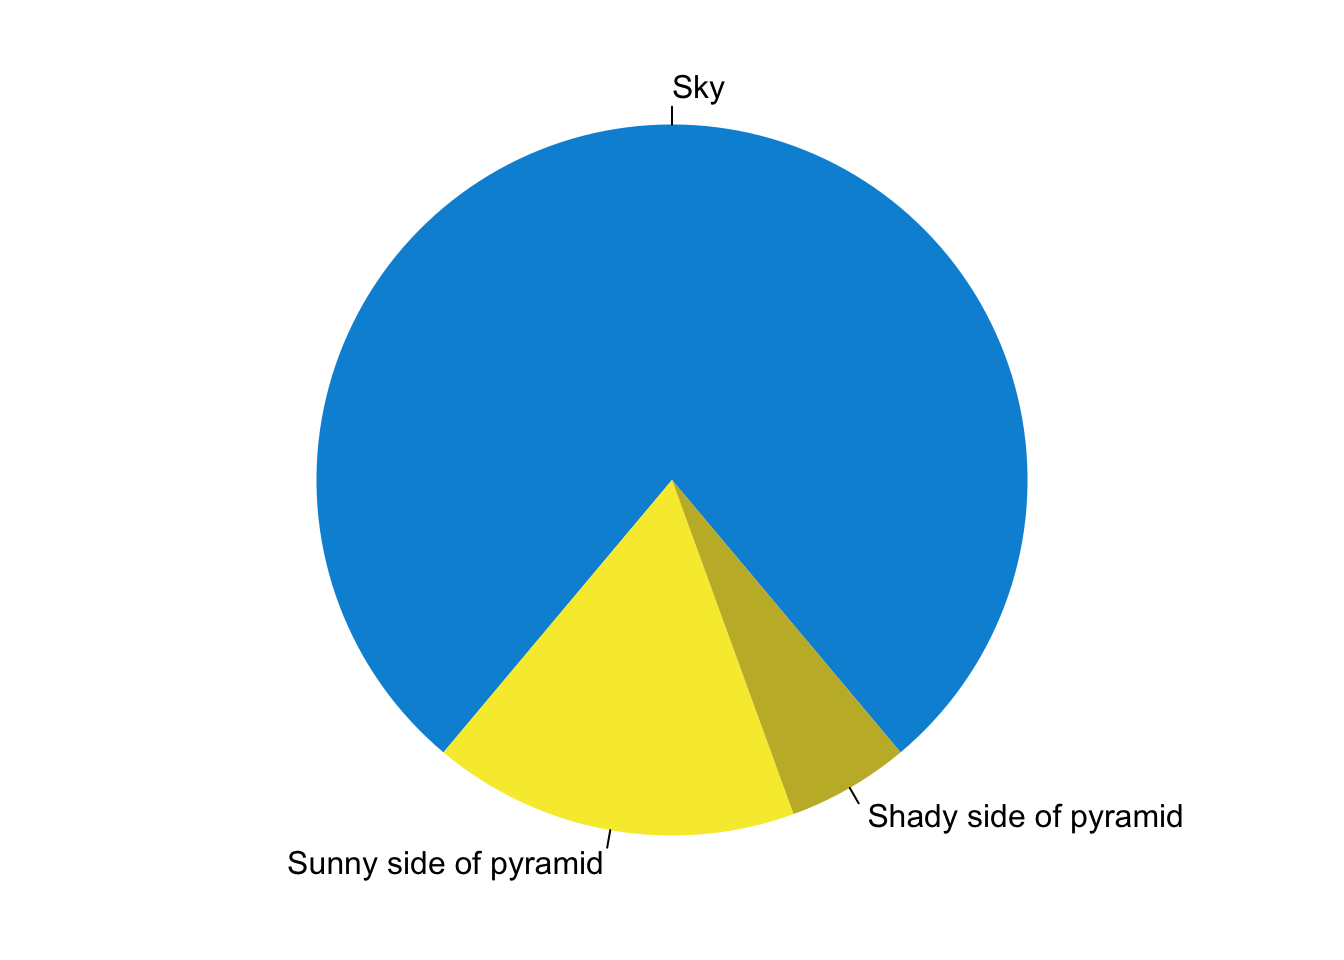
and that you can also embed plots like Figure 1 (from the hugo example):
par(mar = c(0, 1, 0, 1))
pie(
  c(280, 60, 20),
  c('Sky', 'Sunny side of pyramid', 'Shady side of pyramid'),
  col = c('#0292D8', '#F7EA39', '#C4B632'),
  init.angle = -50, border = NA
)
Figure 1: A fancy pie chart.
Next up, I’ll talk about RHRV probably, and my attempts at making it work for me instead of Kubios or Artiifact, so I can pipeline analysis of HRV data in our studies.